Alignment#
This notebook demonstrates a simulated alignment using tike.
[1]:
import logging
import lzma
import pickle

import matplotlib.pyplot as plt
import numpy as np

import tike.align
import tike.view
[2]:
for module in [tike, np]:
    print("{} is version {}".format(module.__name__, module.__version__))
tike is version 0.25.1.dev4+gdf3f9c5
numpy is version 1.26.0
Create test data#
Make test data for the alignment problem.
Define the object#
[3]:
with lzma.open('../../../tests/data/algin_setup.pickle.lzma', 'rb') as file:
    [data, original, flow, shift] = pickle.load(file)
[4]:
plt.figure()
tike.view.plot_phase(original[0])
plt.show()
(-0.99961144+0.02402014j) (0.99890274+0.03243559j)
Define the shifts#
Each image has a single shift direction in 2 dimensions.
[5]:
np.random.seed(5)
shift = (np.random.rand(original.shape[0], 2) - 0.5) * 3
shift
[5]:
array([[-0.83402049, 1.11219692]])
Simulate the shifted images#
[6]:
data = tike.align.simulate(
    shift=shift,
    original=original,
    flow=None,
    padded_shape=None,
    angle=None
)
data.shape
[6]:
(1, 128, 128)
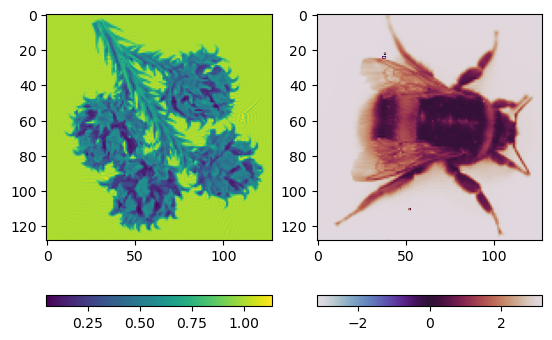
[7]:
plt.figure()
tike.view.plot_phase(data[data.shape[0] // 2])
(-1.0739715+0.36731178j) (1.0649564+0.027201965j)
Reconstruct#
Now we need to try and reconstruct psi.
[8]:
# Provide initial guesses for parameters that are updated
result = {
}
[9]:
logging.basicConfig(level=logging.INFO)

for i in range(1):
    result = tike.align.reconstruct(
        unaligned=data,
        original=original,
        algorithm='cross_correlation',
        **result,
        num_iter=1,
        upsample_factor=100,
    )
INFO:tike.align.align:cross_correlation on 1 - 128 by 128 images for 1 iterations.
[10]:
result['shift']
[10]:
array([[-0.83, 1.11]], dtype=float32)
[11]:
shift
[11]:
array([[-0.83402049, 1.11219692]])