Scanning trajectories#
Tike contains a module full of functions which may be used to construct scanning trajectories as a function of time. Below are examples of some of these functions.
[1]:
import matplotlib.pyplot as plt
import numpy as np

import tike.scan as tike
[2]:
tike.scantimes(t0=0, t1=10, f=1)
[2]:
array([0., 1., 2., 3., 4., 5., 6., 7., 8., 9.])
[3]:
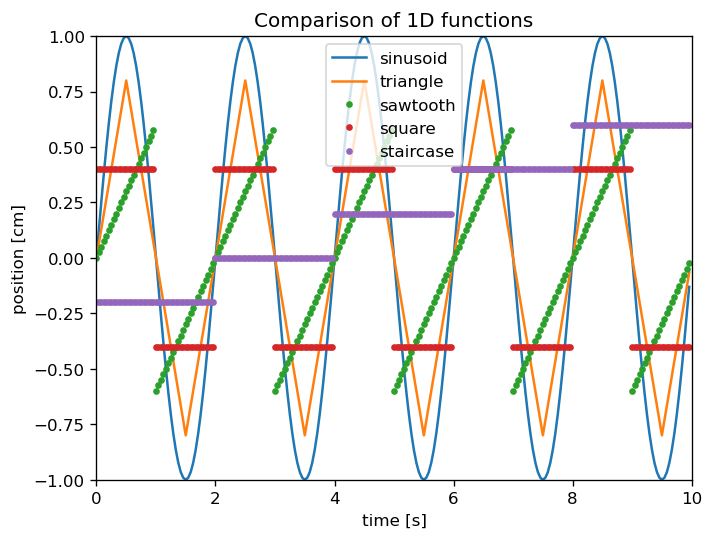
times = tike.scantimes(t0=0, t1=10, f=24)

freq = 1/2
phase = 2*np.pi

x = tike.sinusoid(A=1, f=freq, p=phase, t=times)
y = tike.triangle(A=0.8, f=freq, p=phase, t=times)
z = tike.sawtooth(A=0.6, f=freq, p=phase, t=times)
i = tike.square(A=0.4, f=freq, p=phase, t=times)
j = tike.staircase(A=0.2, f=freq, p=phase, t=times)

plt.figure(dpi=120)
plt.title('Comparison of 1D functions')
plt.plot(times, x, times, y, times, z, '.', times, i, '.', times, j, '.')
plt.ylim([-1,1])
plt.xlabel('time [s]')
plt.xlim([0,10])
plt.ylabel('position [cm]')
plt.legend(['sinusoid', 'triangle', 'sawtooth', 'square', 'staircase'])
plt.show()
[4]:
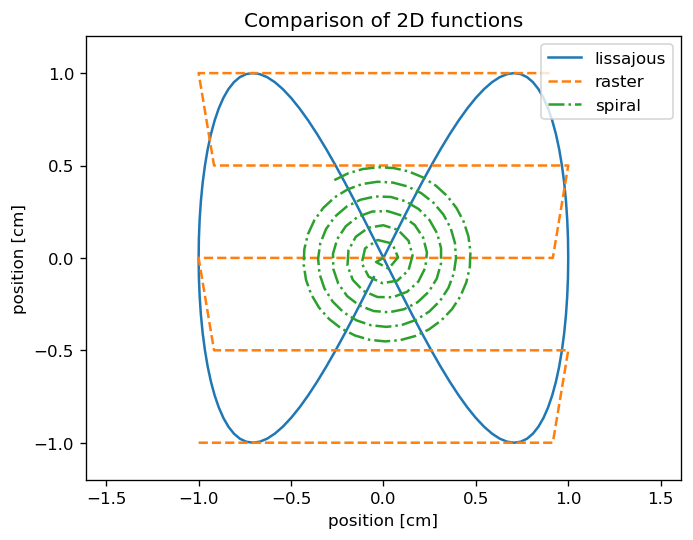
times = tike.scantimes(t0=0, t1=1, f=120)

x1, x2 = tike.lissajous(A=1,B=1,fx=1,fy=2,px=0,py=0,t=times)
y1, y2 = tike.raster(A=2,B=1/2,f=5,x0=-1,y0=-1,t=times)
z1, z2 = tike.spiral(r1=1/2,t1=1,v=10,t=times)

plt.figure(dpi=120)
plt.title('Comparison of 2D functions')
axes = plt.plot(x1, x2, y1, y2, '--', z1, z2, '-.')
plt.ylim([-1.2,1.2])
plt.xlabel('position [cm]')
plt.xlim([-1.2,1.2])
plt.ylabel('position [cm]')
plt.legend(['lissajous', 'raster', 'spiral'])
axes[0].axes.set_aspect('equal', 'datalim')
plt.show()
[ ]: